Pokémon Legendary Classifier
Goal: To construct a classification model that accurately predicts whether a newly observed Pokémon is legendary.
PythonVisualization, k-Nearest Neighbors, Logistic Regression, Over and Under-Sampling Technique
Method
- Obtain information on the win rates of Pokémon from the combats table.
- Check the correlation between all Pokémon stats to identify predictors most associated with a Pokémon being legendary.
- Construct k-Nearest Neighbor (kNN) models by training on generation 1-6 Pokémon, then check performance by testing on generation 7 Pokémon.
- Construct logistic regression models by training on generation 1-6 Pokémon, then check performance by testing on generation 7 Pokémon.
- Attempt over- and under-sampling techniques to deal with heavily imbalanced classes (8% legendary vs. 92% non-legendary) and recreate kNN and logistic regression models, then test on generation 7 and 8 Pokèmon.
The full project can be found on my GitHub.
Part 1: Win rates from the Combats table
Pandas
Using data from the
Combats
table, I aggregated the total number of wins a Pokémon has received.Next, I left-joined the
Pokémon
table to the combats table to ensure all Pokémon were preserved, even if we had no data on combats for that Pokémon because it wasn't present in the combats table.
The new table
pkmn_join has the following information for each Pokemon in generations 1-6:
- Hit Points (HP)
- Attack
- Defense
- Special Attack (Sp. Atk)
- Special Defense (Sp. Def)
- Speed
- Type 1
- Type 2
- Number of wins
Part 2: Visualizing Correlation
Matplotlib and Seaborn2.1 Scatterplots
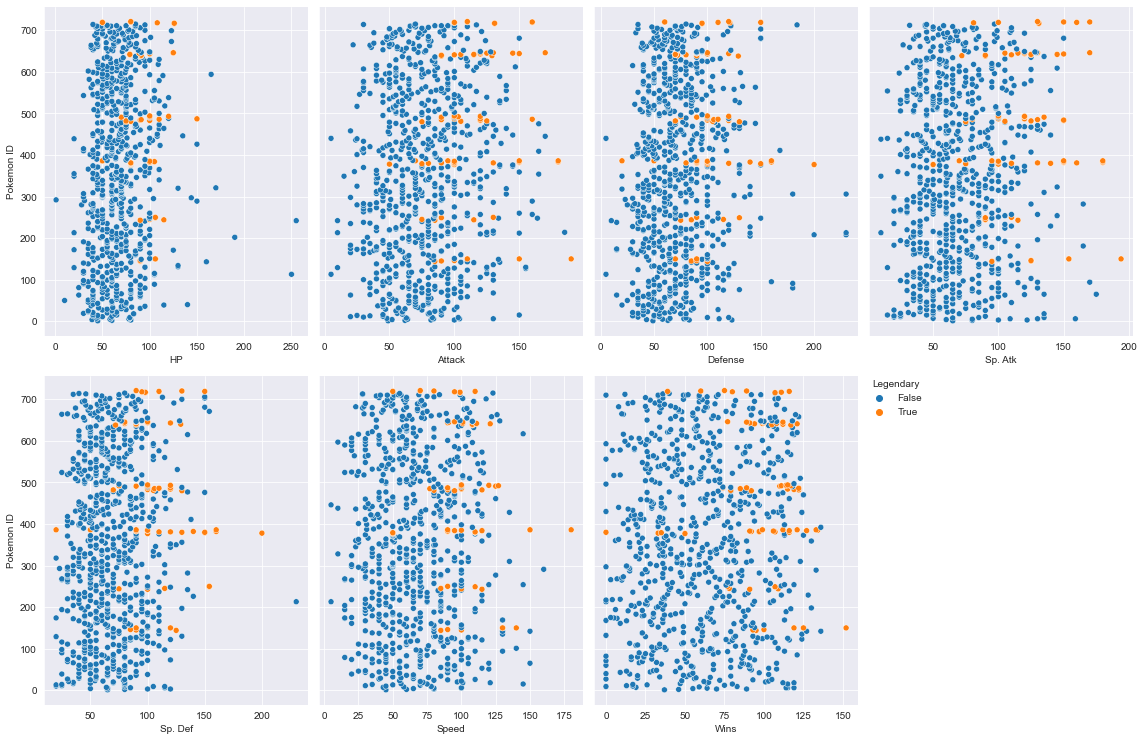
Looking at the pairplots above, we can see that, in general, legendary Pokémon tended to have higher stats in every category.
Given this information, I was curious how correlated a new predictor called "Total Stats," which was the sum of HP, Attack, Defense, Sp. Atk, Sp. Def, and Speed, would be with a Pokémon's legendary status.
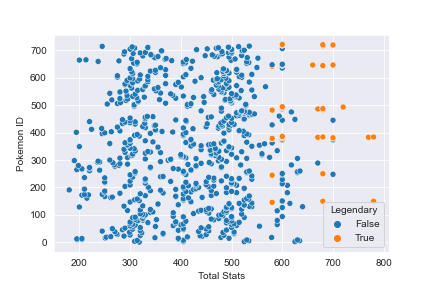
When plotting the new feature Total Stats, it's much easier to see that legendary Pokémon tend to have higher Total Stats than non-legendary Pokémon. While we don't see perfect separation between the groups, the decision boundary is much more clear than any of the scatter plots that focused on just a single Pokémon stat.
2.2 Heatmaps
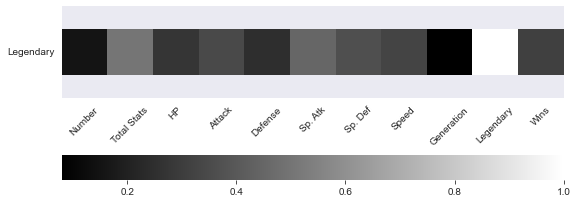
Using the heatmap above, we can see the predictors most strongly correlated with a Pokémon being legendary: Special Attack, Special Defense, Attack, Speed, Wins, and Total Stats.
Unsurprisingly, Total Stats had the highest correlation overall and will become quite useful when progressing further in the analysis.
Part 3: k-Nearest Neighbors (kNN)
Sklearn and Statsmodels
3.1 Feature scaling
Because kNN classification compares the Euclidean distance between points when classifying a new observation, it's important to ensure all of your numerical predictors are on the same scale. If scaling isn't performed, then predictors that are on a much larger scale will appear to have a stronger correlation with a Pokémon being legendary, which will skew our understanding of the model. To prevent this, using Sklearn, I standardized all numerical predictors to have a mean of zero and a standard deviation of one.
3.2 Hyperparameter tuning: Which k is optimal?
Afterwards, I trained various models using different combinations of predictor variables and used hyperparameter tuning to determine the optimal number of neighbors (k) that would maximize predictive accuracy for each of those models. The model that performed best was one that used Total Stats as the only predictor variable with k = 5 and was trained on all Pokémon from generations 1-6.
3.3 Estimating test performance: k-Fold Repeated Cross Validation
To estimate this model's performance on testing data, I performed 5-Fold Repeated Cross Validation (KFRCV) on the generation 1-6 data.At first, the model appeared to do quite well, having 92% predictive accuracy. However, given that roughly 92% of Pokémon in the data set are non-legendary, a naive model that guesses a new Pokémon is non-legendary every time will achieve the same accuracy.
3.4 Deceptively high test performance
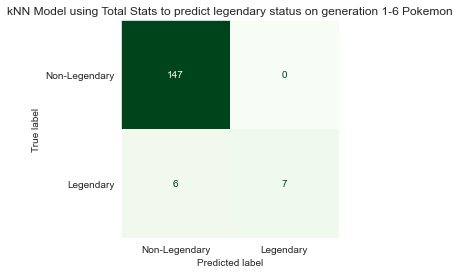
I was suspicious that the model may be heavily biased towards predicting Pokémon as non-legendary, and my suspicions were confirmed when checking predictions from one randomly generated test set. Virtually all of the predictions made by the model were non-legendary.
3.5 Checking performance on generation 7 Pokémon
Despite having low confidence in this model, I was still curious how it would perform on Pokémon from generation 7. Generation 7 has a lower proportion of non-legendary Pokémon (82%) and a higher proportion of legendary Pokémon (18%) as compared to the previous generations 1-6, which had 92% non-legendary and 8% legendary.
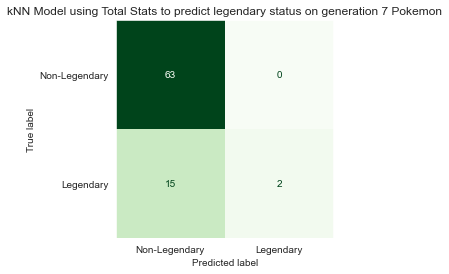
To little surprise, this model achieved roughly 82% accuracy, as it continued to employ a strategy that was heavily biased towards predicting Pokémon as non-legendary. With this in mind, I began searching for other models that could perform better.
Part 4: Logistic Regression
Sklearn and Statsmodels
4.1 Estimating test performance: k-Fold Repeated Cross Validation
To estimate performance on testing data, I performed repeated cross-validation on a logistic regression model that used Total Stats as the only predictor. This model achieved an average of 93% accuracy, just about the same as the kNN model from earlier, and I was once again skeptical.
4.2 Skeptical of high test performance
Feeding the same testing set used on the kNN model in "3.4 Deceptively high test performance," into the logistic regression model resulted in the exact same accuracy for both models. It looks as if this model may be running into the same pitfalls as the last one.
4.3 Checking performance on generation 7 Pokémon
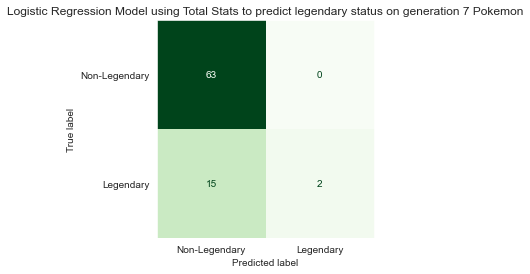
The logistic regression model yielded the same accuracy (82%) as the kNN model on generation 7 Pokémon.
Investigating further, both models made the exact same predictions. Out of 80 new Pokémon in generation 7, both models predicted 78 would be non-legendary and only 2 would be legendary.
Unfortunately neither kNN nor logistic regression do much better than a naive model, which always guesses a newly observed Pokémon will be non-legendary. The search for a better model continues.
Part 5: Over and Under-Sampling Techniques
Imblearn
5.1 Background
Classification algorithms have a tough time when working with largely imbalanced datasets. These algorithms are designed to maximize performance, and sometimes the best way to do that is to always guess the same thing. For instance, in the Pokémon data from generations 1-6, 92% of the Pokémon are non-legendary. If the model always guesses non-legendary, it will be right 92% of the time, which is close to the maximum of 100%. Increasing performance above 92% will be difficult, but that is the key difference in making the model great.Using a combination of over- and under-sampling techniques, the generation 1-6 Pokémon data set can be transformed, and new models can be trained on the transformed data. Using the imbalanced_learn library from SKlearn, one can over-sample the minority class by creating new "synthetic" minority observations and add them to the data set, as well as under-sample the majority class by removing majority observations. Chaining these together will produce a synthetic dataset that is more balanced and easier to train the model on. Because we want to understand how the model reacts to new data, the model will still be tested on untransformed data to more closely resemble incoming, newly unseen data.
5.2 kNN and Logistic Regression Performance on Gen 7 and Gen 8 Pokémon
After employing both techniques, kNN and logistic regression both saw significant increases in performance and, all of a sudden, weren't biased towards predicting non-legendary anymore. Both models adapted well to new Pokémon from generation 7, as well as from generation 8, having 94% and 92% accuracy, respectively. Interestingly, both kNN and logistic regression performed exactly the same, making the exact same predictions on both generations of Pokèmon, as can be seen below.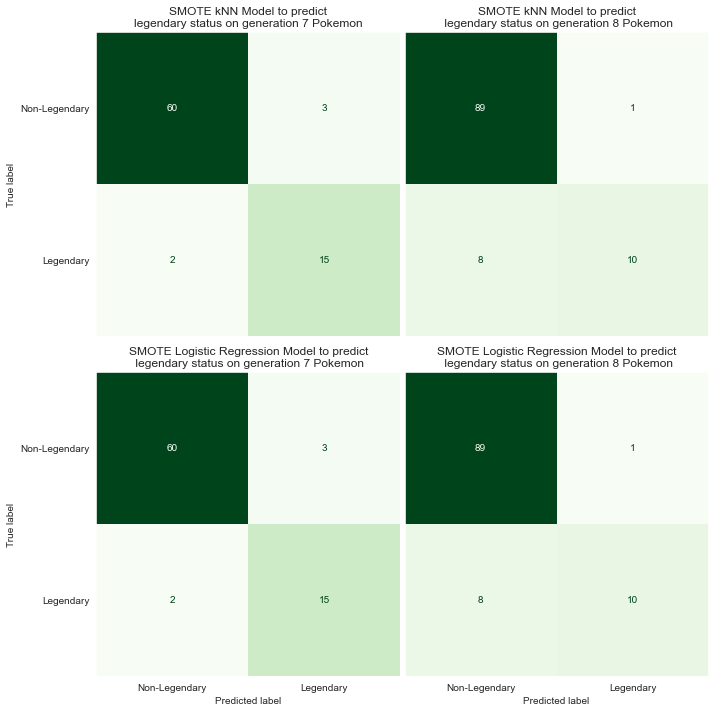
There are probably better models out there, but since they're performing equally well, for now kNN and logistic regression are tied. They're both performing well, adapting nicely to new data, and have decent predictive power.
Part 6: Coming Soon
Will other models like Linear Discriminant Analysis or Quadratic Discriminant Analysis perform better?Also, revisiting kNN and logistic regression one more time and altering the bayes decision boundary.