U.S. Accounting Survey Analysis
Goal: To understand the typical accountant and the accounting field.
Python, ExcelData Cleaning, Exploratory Data Analysis, Visualization, Linear Regression
Background
Because my wife was preparing to enter the field of accounting and I was looking to develop projects to demonstrate proficiency with data analysis, I combined the two ideas together to create this project.
My wife had done her own research on the field in regards to maximizing long-term salary earning potential. She stated that accountants with their CPA license earn more, as do accountants who start at a public accounting firm and then transition into working as an accountant in industry at a private company.
I used this data to better understand if those statements are true, as well as what a typical accountant looks like, by breaking the analysis into three Jupyter notebooks:- Data Cleaning
- Exploratory Data Analysis
- Regression Analysis
I've summarized my methodology and the results below; however, the full project goes into much more detail. It can be found on my GitHub.
Part 1: Data Cleaning
Pandas, NumPy, MatplotlibThe data came from a yearly Google Forms survey collected from users of the r/Accounting section of Reddit. The data was downloaded as an Excel CSV file and imported into a Pandas DataFrame object for cleaning and manipulation.
1.1 Remove unncessary data:
Information regarding when a survey response was collected was removed as it isn't helpful in understanding the accounting field.Furthermore, although the survey was global, 87% of respondents indicated living in the US. Given that my wife will be an accountant in the US, I dropped survey responses coming from other countries. After dropping non-US accountants, there were still 1201 survey responses.
1.2 Cleaning strings:
Since the survey responses came from Google Forms, which prompts users to type in their responses to the survey questions, all the data in our CSV file are strings. Fields that related to numerical entries, such as salary or hours per week, needed to be manipulated.- Values like "73k" needed to be changed to 73000
- Commas and dollar signs needed to be removed
Additionally, I was able to distill 2 distinct entries for "Gender" down to 1 by renaming the "Prefer not to say" and "Other" categories into "Undisclosed".
1.3 Converting columns to appropriate types
Fields like "Current Salary + Bonus," "Years of Experience," "Average Hours Per Week," or "Years Public Before Exit" all needed to be re-cast from string to float.
1.4 Replacing/Imputing Null values
Gender: replaced Null values with UndisclosedLine of Service: replaced Null values with Other
Current Industry: replaced Null values with Other
Distribution of salaries was right-skewed, imputed Null values with the median.
Distribution of years of experience was right-skewed, imputed Null values with the median.
Cost of living: imputed Null Values with the mode.
Part 2: Exploratory Data Analysis (EDA)
Pandas, NumPy, Matplotlib, and Seaborn
| Qualitative Fields | Quantitative Fields |
|---|---|
| Exit Status | Years Experience |
| Has CPA | Current Salary + Bonus |
| Current Industry | Years Public Before Exit |
| Cost of Living | Average Hours Per Week |
| Gender | |
| Line of Service |
The purpose of the EDA is to begin analyzing the quantitative data to better understand the typical US accountant. What's the typical salary, typical years of experience, hours worked per week, etc.?
Once a baseline for the typical accountant was established, I began to use the qualitative data to understand different segments of the accounting population. For instance, what is the typical salary for male vs. female accountants, or for accountants who have their CPA license vs. those who don't?
While performing the EDA, I'm also looking for data that will support my wife's research regarding which factors will increase an accountant's long-term salary earning potential. Namely:
- What impact does having a CPA license have on your annual salary?
- What impact does beginning one's career as an accountant for a public accounting firm have compared to beginning a career as an accountant for a company in the private industry?
- Are there any accountants in the survey who are considered outliers, and can they provide any insight into the field?
2.1 Key Findings
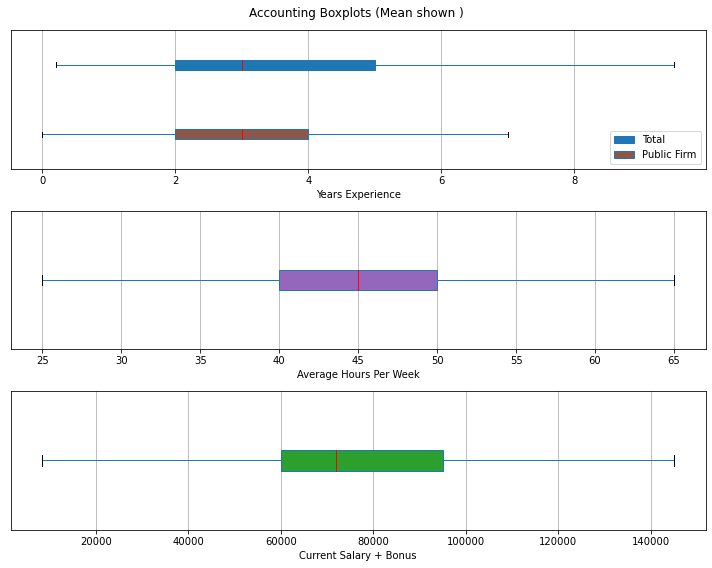
The typical US accountant:
- Has between 2-5 years of experience.
- Has spent 2-4 years working at a public accounting firm before transitioning to work as an accountant in a private industry.
- Has an average workweek between 40 and 50 hours per week.
- Earns between $60,000 and $95,000 annually, with median earnings around $73,000.
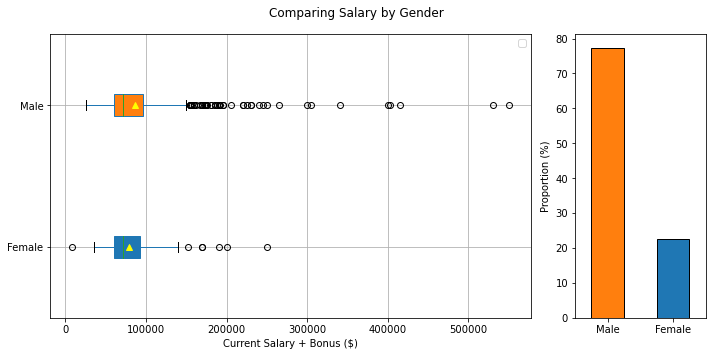
Segmenting based on Gender:
- An overwhelming majority of respondents to the survey are male (roughly 3.5:1), and there is some evidence to indicate a pay gap between male and female accountants exists. These differences are visualized in a Tableau story in another project of mine, the US Accounting Viz.
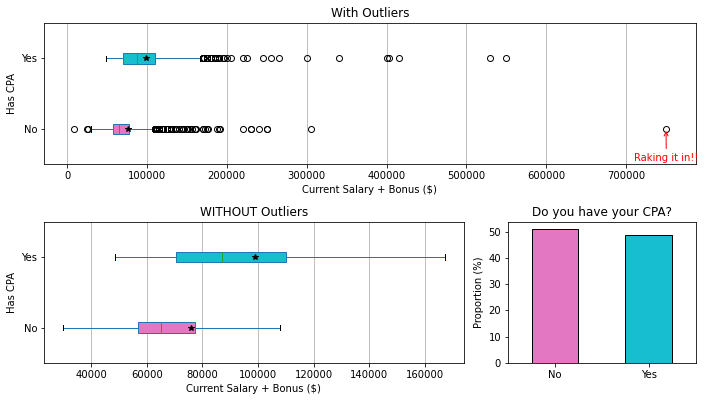
Segmenting based on Has CPA:
- Roughly half of US accountants have their CPA; however, those who have their license realize a very tangible increase in their average annual salary.
- Accountants with their CPA license have a mean annual salary that is $24,000 higher (denoted by the black star in the boxplots) and a median annual salary that is $22,000 more than accountants who don't have their CPA license.
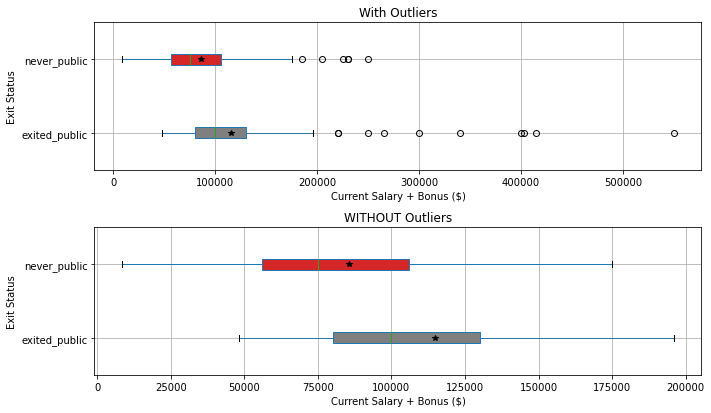
Segmenting based on Years Public Before Exit:
- Accountants who spent several years working in a public accounting firm before transitioning to work in private industry had a mean and median annual salary that was $25,000 higher than their counterparts who had only ever worked in private industry. (The mean is denoted by the black star in the boxplots.)
Outliers:
- An accountant was considered an outlier if their annual salary was greater than two standard deviations from the mean. These accountants tended to have much more work experience and have probably been in the industry long enough to reach senior positions that pay large salaries.
- The pay gap among genders is very pronounced here, with some male accountants earning as much as $100,000 more than their female counterparts, who have just as many, if not more, years of work experience.
2.2 Conclusion(s):
The research my wife had done on her own seems to agree with the data in the survey. If one's primary goal is to maximize long-term earning potential, one should get their CPA license as early as possible and begin their career by spending several years at a public firm, then transition into a private industry.Part 3: Regression Analysis
Pandas, NumPy, Matplotlib, Seaborn, SciPy, Sklearn, and StatsmodelsThe purpose of the regression analysis is to quantify the extent to which changing factors such as years of experience, having one's CPA license or not, etc., have on yearly salary.
3.1 Method:
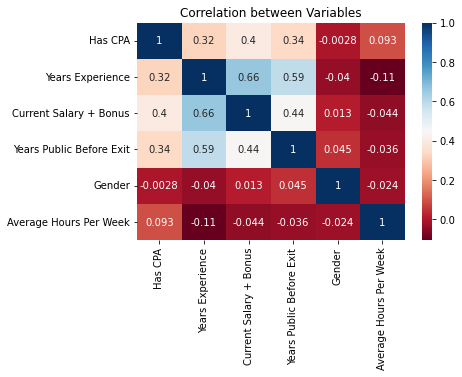
- Use heatmaps to visualize the correlation between all of our variables and annual salary.
- Years Experience and Years Public Before Exit were the quantitative variables most correlated with Current Salary + Bonus
- Has CPA also showed moderate correlation with Current Salary + Bonus
- Construct various simple, polynomial, and multi-variate linear regression models and check if conditions for linear regression are present.
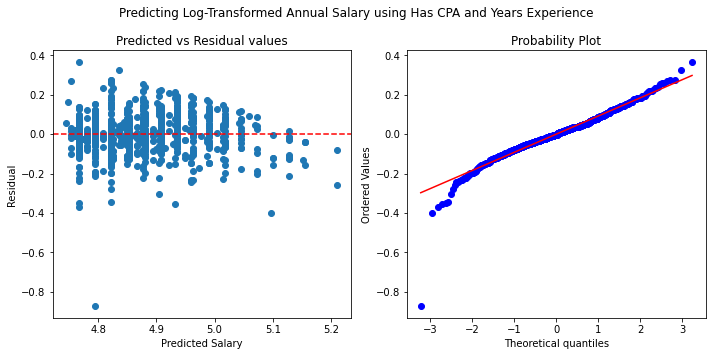
- Check residual plots.
- Check QQ normal probability plots.
- Construct models using training data and verify performance against testing data.
3.2 Conclusion(s):
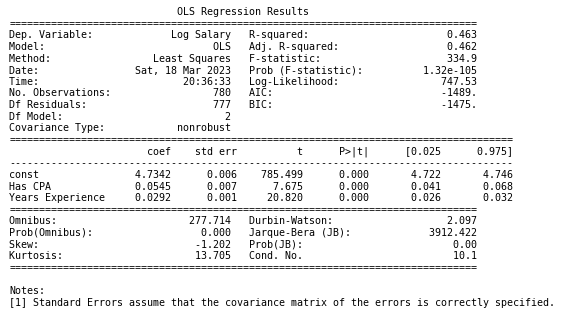
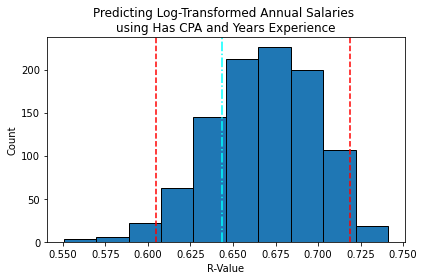
- The model that performed best on testing data was a multi-variate linear regression model, which used "Has CPA" and "Years Experience" to predict annual salary. The model has an estimated R2 score between 0.60 and 0.72 when verified against many different train/test splits through a bootstrap process.
- Accountants with their CPA license have annual earnings about 1.13 (10^0.0545) times more than accountants who don't have their license.
- For each additional year of experience, an accountant will typically earn 1.07 (10^0.0292) times more than the previous year.