U.S. Accounting Viz
A Tableau story about gender differences among male and female accountants.
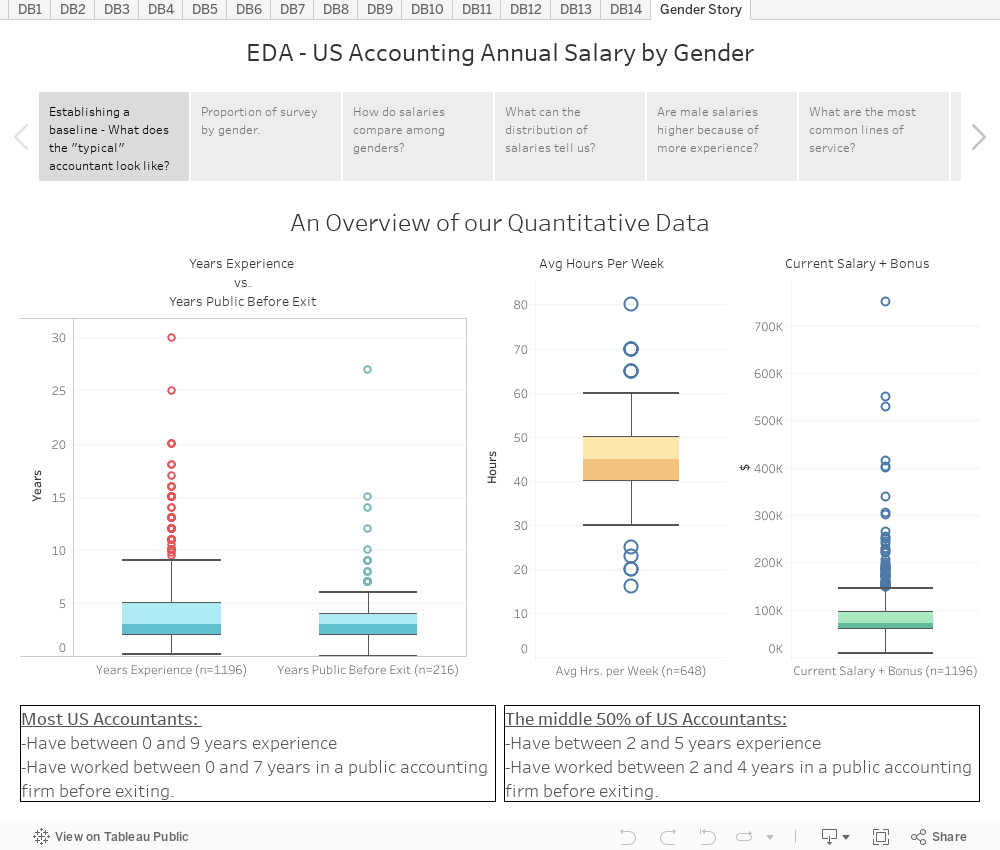
TableauVisualization
Background
Using the cleaned data from one of my other projects, the U.S. Accounting Survey Analysis , I created many dashboards and organized them into a story.Use the arrows that are above the dashboard to scroll from one slide to the next.
Note: The dashboards aren't optimized for tablets or mobile devices and are best viewed on a desktop or laptop.